Pro-Insights Reporting Package for Law Firm Finance FP&A
Clear Profitability Analysis
easily presentable to
Practice Management
Interact with our Pro-Insights package below. Each Power BI report includes customizable metrics and calculations that are tailored for Legal Practices.
Data Analytics Supported Profitability Analysis
Our legal firm data analytics solution offers a unique approach to combining various data sources with financial data in a single unified space. With our platform, your firm can integrate HR resource planning, improved cost transparency, and budgeting to gain a comprehensive view of your business.
Our approach aims to provide your firm with greater cost transparency and more accurate budgeting. You can also forecast and scenario plan to make informed decisions about resource allocation and hiring needs.
By combining these data sources in a single unified space, the end goal is to enable your firm to make data-driven decisions and optimize your operations for maximum efficiency.

Timekeeper/Fee-Earner
Profitability Dashboard
Our available filters enable you to segment data in various ways, such as Industry/Client hierarchy, Office, Title, and even analyzing a single Docketing timekeeper/fee-earner. Plus, our dashboard displays client matter at a detailed level of the Client-Industry hierarchy, or as a drill-through report, and the data is filtered for all clients specific to a responsible timekeeper.
What’s more, our timekeeper data presentation includes a Timekeeper Summary card, Billable Hours by client, Profitability comparison, Timekeeper P&L, and Gauges showing calculated Profit Margin, Leverage, Utilization, and Realization.
With this comprehensive overview of a timekeeper’s docketed hours, utilization, cost to serve, write-offs, realization, and other metrics, you can make strategic decisions to enhance revenue and reduce costs
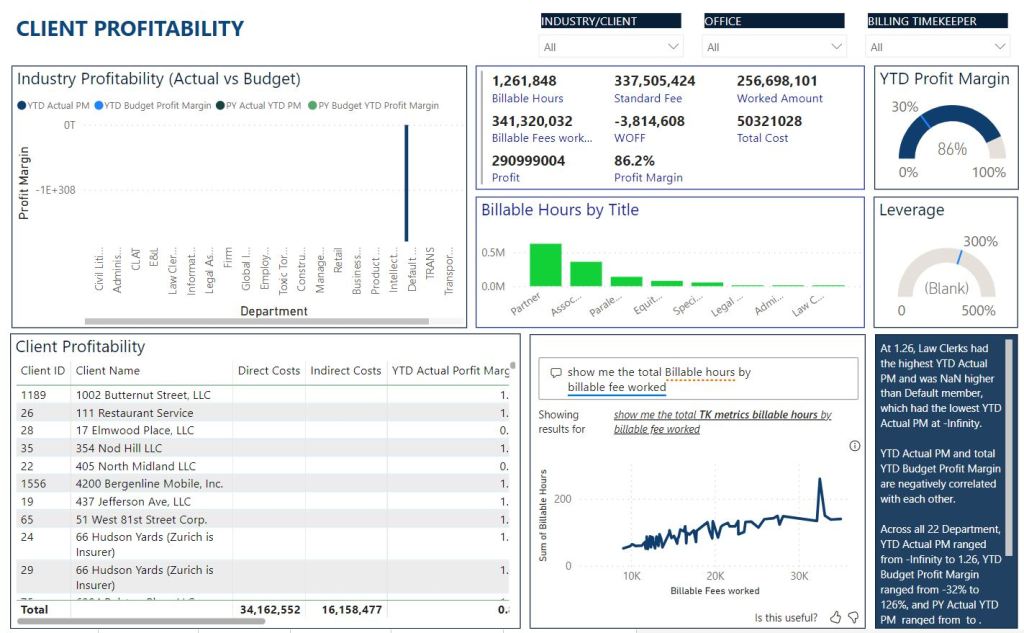
Client Profitability Dashboard
The profitability comparison feature on our dashboard enables you to easily compare your actual vs. budget or year-over-year profitability by industry, client, or matter. With our summary card, you can see billable hours, fees, write-offs, costs, profit, and profit margin at a glance. And, at the bottom of the dashboard, a profitability by client report is available for deeper analysis.
With this information, you can make informed decisions about where to allocate Partner and other timekeeper time. You’ll be able to easily identify which clients and matters are most profitable and which ones need attention to become profitable. Our interactive dashboard allows for quick and easy identification and addressing of unprofitable client matters, resulting in increased revenue and decreased costs.
Financial Overview
The Financial Planning and Analysis (FP&A) PowerBI dashboard for a legal firm provides a comprehensive overview of key financial metrics. The dashboard is structured with various panes to facilitate easy interpretation and analysis.
- Actual vs. Budget Gross Profit Performance:
This pane prominently displays the comparison between actual and budgeted gross profit performance. It provides a visual representation of the variance, allowing stakeholders to quickly assess how well the firm is meeting its financial goals.
- Revenue by Location:
In this section, a geographical breakdown of revenue is presented using an interactive map or a bar chart. This allows users to identify high-performing and underperforming locations, enabling strategic decision-making for resource allocation and business development.
- OPEX Ratio CRR (Cost-to-Revenue Ratio):
This pane focuses on the OPEX ratio as a percentage of revenue, providing insights into the efficiency of cost management. Users can track trends over time and compare performance against industry benchmarks, helping in optimizing operational expenses.
- Cost of Revenue KPIs:
This section is dedicated to key performance indicators related to the cost of revenue. Metrics such as cost per client acquisition, direct labor costs, and other relevant KPIs are displayed to give a detailed understanding of the cost structure impacting the revenue.
- Total Revenue by Practice Departments:
The final section of the dashboard highlights the total revenue generated by different practice departments within the legal firm. Each practice area is represented with visual elements such as stacked bar charts or pie charts, enabling a quick comparison of their respective contributions to the overall revenue.
The dashboard employs color coding, trend indicators, and drill-down capabilities to enhance user experience and encourage deeper analysis. It is designed to provide legal FP&A professionals with a holistic view of financial performance, facilitating informed decision-making and strategic planning.
Financial Performance Report
The Financial Performance Report Dashboard offers a comprehensive overview of the firm’s financial health, combining key ratios, growth indicators, and departmental revenue insights.
Here’s a concise summary:
- EBITA (Earnings Before Interest, Taxes, and Amortization):
Highlights the firm’s operational profitability by showcasing EBITA, a key financial metric that excludes non-operating expenses. This helps assess the core earnings performance.
Revenue Year-over-Year (YOY) Growth:
Presents the percentage change in revenue compared to the same period in the previous year, providing a clear snapshot of the firm’s growth trajectory.
Year-to-Date (YTD) Revenue:
Displays the cumulative revenue generated year-to-date, allowing stakeholders to track the firm’s financial performance throughout the fiscal year.
Top 10 Revenue Grossing by Practice Departments:
Identifies and ranks the top-performing practice departments based on revenue contribution. This insight aids in recognizing areas of strength and allocating resources effectively.
Revenue vs. Expense by Quarter:
Offers a quarterly breakdown of both revenue and expenses. This allows for a detailed analysis of financial performance trends and helps in identifying quarters with significant variations.
Summary Income Statement:
Provides a condensed version of the income statement, summarizing key components such as revenue, expenses, and net income. This section offers a quick reference for overall financial performance.
The dashboard incorporates visual elements, such as charts and graphs, to enhance data interpretation. Users can easily navigate through the report to gain a holistic understanding of the firm’s financial performance, enabling strategic decision-making and effective financial planning.
Detailed Income Statement
A streamlined Comprehensive Income Statement condenses details by providing a line-by-line summary of information from the General Ledger.
We offer improved visibility into the key areas of your operations
Stale Data
Stale data may be the result of delayed or missed documentation, inconsistent data entry practices, or insufficient staff training on documentation and data management procedures. Without the real-time data, it limits the ability to identify and address your most problematic areas of practice or expenses that affect your organization's profitability.
Unified HR and Finance Systems
Disconnected systems reduce your efficiency levels, making it difficult for the Office of Finance to quickly uncover key metrics and insights about your personnel resources. By ensuring that finance and HR systems are properly integrated and aligned, law firms can improve their ability to identify where to divert resources, which can support dynamic preparedness across all areas of practice.
Audit Readiness
Centralized reporting and record-keeping makes it easy for the Law Firm to demonstrate their records are in adherence to current regulations. By maintaining accurate and up-to-date data, your law firm can provide auditors with the information they need to verify compliance with audit requirements and identify areas for improvement.
Frequently Asked Questions
If you have any industry-related questions that are not listed here, contact us at contact@prolyticsgroup.com for more details or fill in the form below.
Within 48 hours, someone from our business intelligence team will be in touch with you soon to answer your inquiry. For any immediate inquiries, call 905-947-1223.
If Pro-Insights is a ready-to-go reporting package, would there be an option for us to customize the reports?
The above sample reporting package is designed to be a turnkey and ready-to-go-live solution for businesses that require a quick turnover in BI strategy.
Is there an option to somewhat or fully customize our Pro-Insights Reporting Package?
Quick customization options are available including connecting your data models, fine-tuning business-specific KPIs, additional visualizations, and brand personalizations according to your enterprise's unique aesthetics such as color palette, logos, fonts, and more.
For more options in the building process, collaborate and work with our experts to determine what your must-have and nice-to-have requirements are for your Pro-Insights package and BI strategy. Any dashboards and features can be customized according to your enterprise's needs and requirements.
What if we want to build something unique for our business?
Yes! If you explain your vision and goal, our BI experts will work with you and your team to discuss if your requirements are cost-efficient, feasible, and secure to accomplish within your given timeline and budget.
I am unable to view the sample dashboards.
Give the reports some time to load and connect before exiting. Try adjusting the filters and slicers to load a different set of data. Because we use randomized data, some time periods may not have existing data yet.
If the content is still unable to load after a while, please contact our team at contact@prolyticsgroup.com to troubleshoot this issue or to request a more comprehensive demo and walkthrough with one of our BI experts.
Can I have a comprehensive sample of what organizations in my industry are currently using?
Yes, we can give you an industry-specific demo and walkthrough of this! To do so, contact our team at contact@prolyticsgroup.com to request a more comprehensive demo and you will be scheduled for a booking with our BI team.
Contact Us
Start Your BI Journey
Our goal is to help businesses grow and find areas of opportunities for them. Our Business Intelligence consultants will help you get started by assessing your goals and current tools to create the best plan of action for you.
Email Address
contact@prolyticsgroup.com
Call Us
905-947-1223
Address
100 York Blvd Suite 250, Richmond Hill, ON L4B 1J8, Canada
